K-Means
Takes time (minutes) because I calculated everything in the app. To be fixed later.
More explanations to come.
The K-means algorithm is one of the most popular clustering algorithms. In this post, we will step through and write the K-means algorithm by hand.
The broad steps of K-means are as follows:
Step 1. Choose the K number of clusters.
Step 2. Split the data randomly into K groups.
Step 3. Iterate until the cluster assignments stop changing:
- For each of the K clusters, compute the cluster centroid. The kth cluster centroid is the vector of the p feature means for the observations in the kth cluster.
- Assign each observation to the cluster whose centroid is the closest.
We load the necessary packages into our environment.
library(ggplot2)
library(tidyverse)
library(gganimate)
library(ggnewscale)
library(xfun)
We also load and format the data we want to use. In this post we will use the well known Iris dataset because it is accessible to everyone.
data(iris)
# select the numeric data
iris_data <- iris %>%
  mutate(Species = make.names(Species, unique = T)) %>%
  column_to_rownames("Species")
The Iris dataset has four columns, which is hard to visualize because we can't plot four dimensional plots. We would have to choose two columns of interest and plot those.
head(iris_data)
##          Sepal.Length Sepal.Width Petal.Length Petal.Width
## setosa            5.1         3.5          1.4         0.2
## setosa.1          4.9         3.0          1.4         0.2
## setosa.2          4.7         3.2          1.3         0.2
## setosa.3          4.6         3.1          1.5         0.2
## setosa.4          5.0         3.6          1.4         0.2
## setosa.5          5.4         3.9          1.7         0.4
Instead of plotting and conducting K-means on the raw data, we will plot and use the first two principal components of a principal components analysis. Principal components analysis allows us to visualize the information contained in a high dimensional dataset in fewer dimensions.
The principal components will be our input to K-means.
data <- pcs
We decide on the K, or how many clusters we will consider, as well as the number of iterations of the algorithm.
K = 3 # we set the number of clusters to two for simplicity
cluster_names <- numbers_to_words(1:K) # convert to english word clusters
We first randomly assign cluster labels to each data point.
set.seed(10)
# Randomly assign a number, from 1 to K, to each of the observations.

# Here I sampled from One or Two (because K equals two), for each data point in data.
cluster_id <- sample(cluster_names, nrow(data), replace=TRUE)
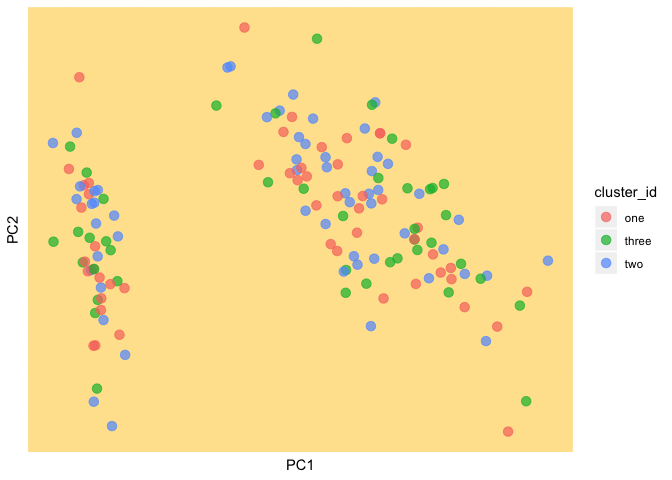
We plot our data and the random cluster assignments
background = "#FFE39B"
(current_clust <- ggplot(as.data.frame(data), aes(PC1, PC2, color = cluster_id)) +
  geom_point(size = 3, alpha = 0.7) +
  theme(panel.background = element_rect(fill = background, color = background),
          panel.grid.major = element_line(color = background),
          panel.grid.minor = element_line(color = background),
          axis.text.x=element_blank(),
          axis.ticks.x=element_blank(),
          axis.text.y=element_blank(),
          axis.ticks.y=element_blank()))
Then we calculate the cluster centroids. We group all data points from the same cluster, and we take the mean.
cluster_centroids <- t(sapply(unique(cluster_id),
       function(x) colMeans(data[cluster_id == x,])))

head(cluster_centroids)
##               PC1         PC2          PC3           PC4
## two   -0.06437320  0.06967492  0.035103946 -1.167106e-02
## one   -0.06626029 -0.03208532 -0.006769407  7.558616e-05
## three  0.16786748 -0.05317521 -0.038424090  1.546783e-02
Then for each cluster centroid that we calculated, we find the distance to each data point. We will use the euclidean distance as our distance metric here. We might consider using squared euclidean distance next time, as it won't get stuck in local minima as much as euclidean distance.
distances <- apply(cluster_centroids, 1, function(x) {
  apply(data, 1, function(y) dist(rbind(x, y)))})

cluster_id <- apply(distances, 1, function(x) colnames(distances)[which.min(x)])
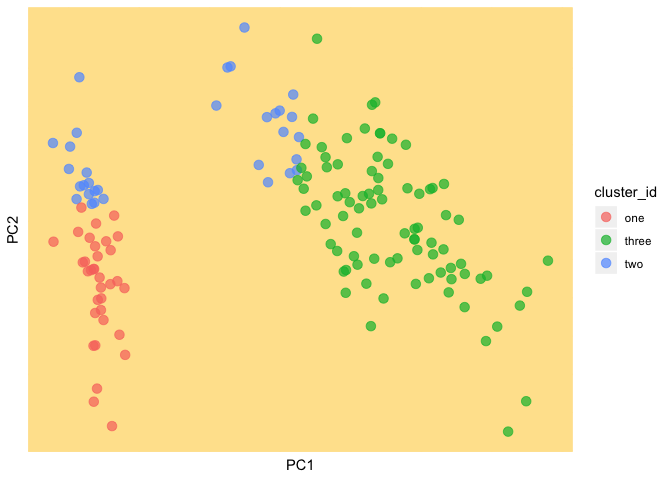
We plot our data and the new cluster assignments
(current_clust <- ggplot(as.data.frame(data), aes(PC1, PC2, color = cluster_id)) +
  geom_point(size = 3, alpha = 0.7) +
  theme(panel.background = element_rect(fill = background, color = background),
          panel.grid.major = element_line(color = background),
          panel.grid.minor = element_line(color = background),
          axis.text.x=element_blank(),
          axis.ticks.x=element_blank(),
          axis.text.y=element_blank(),
          axis.ticks.y=element_blank()))
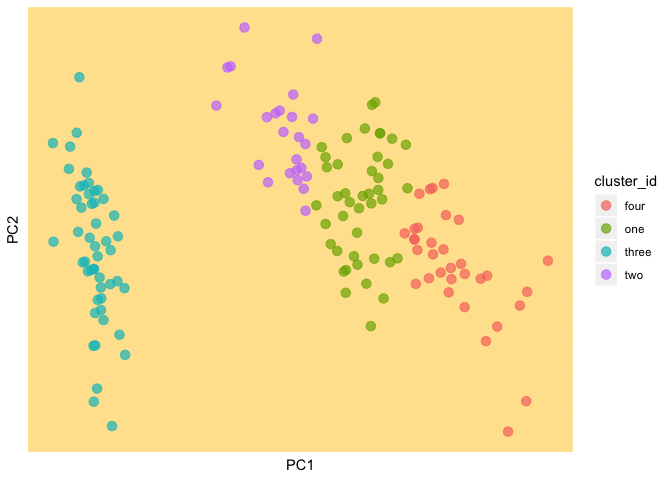
Great. Now we iterate the K-means algorithm until it converges or for a maximum of 100 iterations.
data <- pcs
K = 4 # we set the number of clusters to two for simplicity
cluster_names <- numbers_to_words(1:K) # convert to english word clusters
set.seed(10)
# Here I sampled from One or Two (because K equals two), for each data point in data.
cluster_id <- sample(cluster_names, nrow(data), replace=TRUE)


for(k in 1:100){
  cluster_centroids <- t(sapply(unique(cluster_id),
         function(x) colMeans(data[cluster_id == x,])))

  distances <- apply(cluster_centroids, 1, function(x) {
  apply(data, 1, function(y) dist(rbind(x, y)))})
  cluster_id_new <- apply(distances, 1, function(x) colnames(distances)[which.min(x)])

  new_cluster_num <- sum(cluster_id != cluster_id_new)

  if(new_cluster_num > 3) { # if the clusters assignments for more than 2 data points don't change, return
    cluster_id = cluster_id_new
  } else if(new_cluster_num < 2) {
    print(pastep("It took ", k, " iterations to converge"))
    break
  }
}
(current_clust <- ggplot(as.data.frame(data), aes(PC1, PC2, color = cluster_id)) +
  geom_point(size = 3, alpha = 0.7) +
  theme(panel.background = element_rect(fill = background, color = background),
          panel.grid.major = element_line(color = background),
          panel.grid.minor = element_line(color = background),
          axis.text.x=element_blank(),
          axis.ticks.x=element_blank(),
          axis.text.y=element_blank(),
          axis.ticks.y=element_blank()))